


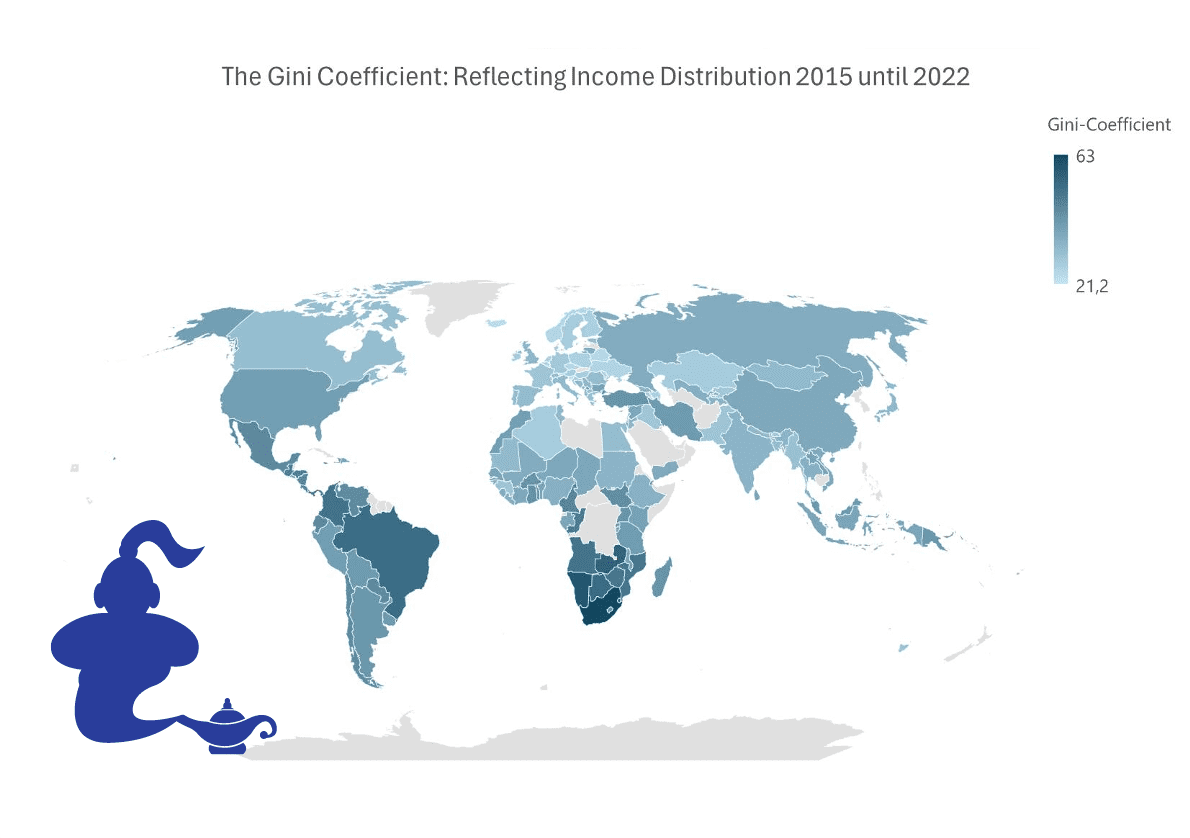
The Gini Coefficient: Reflecting Income Distribution
0
0
0
0

+1.30%
0.00
Category:
Art
Description
The Gini coefficient, ranging from 0 (perfect equality) to 1 (complete inequality), measures income or wealth distribution within a population. It is derived from the Lorenz curve, which compares the cumulative income or wealth against the population percentage, offering a clear picture of economic disparity. This metric is crucial for economists and policymakers to assess inequality levels, its effects on society, and the impact of redistributive policies. Though the Gini coefficient highlights general distribution trends, it might not capture all nuances of economic disparity. Nonetheless, it remains an essential tool for analyzing and comparing inequality in various settings. Source: The World Bank (2024): Gini Index: https://data.worldbank.org/indicator/SI.POV.GINI?end=2022&start=1963&view=map&year_high_desc=false [16.03.24]